Introduction
A system is running. No alerts. No visible errors.
But users are already experiencing slow responses, failed actions, and inconsistent behavior.
This is the gap between monitoring and observability.
Traditional monitoring tells you when something is clearly broken.
Observability helps you understand when something is starting to go wrong—before users notice.
In modern distributed systems, where applications span APIs, services, databases, and third-party integrations, waiting for failures is no longer acceptable. The goal is not just to react—but to detect, understand, and resolve issues proactively.
Concept Foundation
Observability is the ability to understand the internal state of a system based on its outputs.
It goes beyond basic metrics and focuses on:
- What is happening? (Metrics)
- Why is it happening? (Logs)
- Where is it happening? (Traces)
These three pillars form the foundation:
- Metrics – Numerical data (CPU usage, response time, error rates)
- Logs – Detailed event records
- Traces – End-to-end request flow across services
The key principle:
Observability is not about collecting data—it is about making systems explain themselves.
How the Problem Occurs
Many systems rely only on basic monitoring:
- Uptime checks
- CPU/memory usage
- Simple error alerts
These are reactive signals.
Problems arise when:
- Latency increases gradually
- Partial failures occur
- Dependencies degrade silently
These issues:
- Don’t trigger immediate alerts
- Affect only certain users
- Accumulate over time
By the time alerts fire, users have already been impacted.
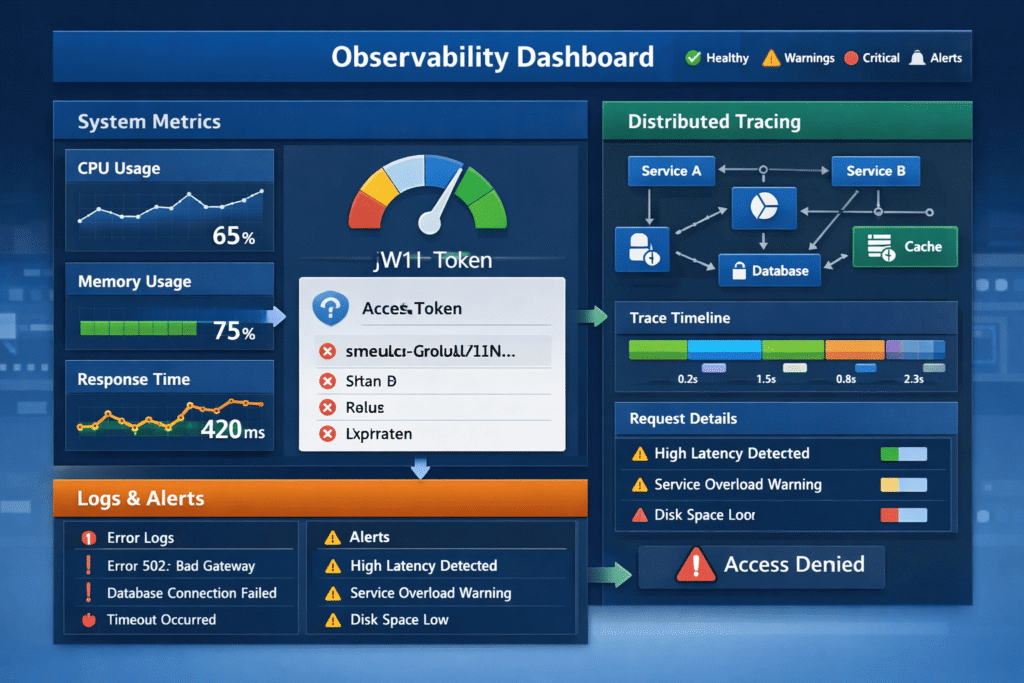
1. Metrics: Detecting Early Performance Degradation
Metrics provide a high-level view of system health.
Key metrics include:
- Request latency
- Error rates
- Throughput
- Resource utilization
Why metrics matter:
They reveal trends—not just failures.
For example:
- Increasing response time may indicate a future bottleneck
- Rising error rates may signal a failing dependency
Best practices:
- Track percentiles (P95, P99), not just averages
- Monitor business metrics (e.g., checkout success rate)
- Set meaningful thresholds—not generic ones
2. Logs: Understanding System Behavior
Logs provide detailed context about what is happening inside the system.
Types of logs:
- Application logs
- Error logs
- Access logs
Common issues:
- Logs are unstructured
- Too noisy or too sparse
- Missing context (user ID, request ID)
Best practices:
- Use structured logging (JSON format)
- Include context (timestamps, IDs, service names)
- Avoid logging sensitive data
Logs answer the question:
What exactly happened during a failure?
3. Distributed Tracing: Following Requests Across Systems
Modern applications are rarely monolithic.
A single request may pass through:
- API gateway
- Backend services
- Database
- External APIs
Tracing allows you to:
- Follow a request end-to-end
- Identify slow components
- Detect bottlenecks
Example:
A checkout request fails.
Tracing shows:
- API gateway → OK
- Payment service → slow
- External provider → timeout
Without tracing, this root cause is difficult to identify.
4. Correlating Metrics, Logs, and Traces
Individually, each pillar provides insight.
Together, they provide understanding.
Example workflow:
- Metrics show increased latency
- Logs reveal database timeouts
- Traces identify the slow query
This correlation transforms observability from data collection into actionable intelligence.
5. Proactive Alerting: Moving Beyond Reactive Monitoring
Alerts should not just signal failure—they should predict it.
Reactive alert:
- “System is down”
Proactive alert:
- “Error rate increased by 20% in last 5 minutes”
- “Latency trending upward beyond baseline”
Best practices:
- Use anomaly detection instead of fixed thresholds
- Avoid alert fatigue by prioritizing critical signals
- Align alerts with business impact
6. Observability in Microservices and Distributed Systems
In distributed architectures, observability becomes critical.
Challenges include:
- Multiple services interacting
- Network latency
- Independent deployments
Solutions:
- Centralized logging systems
- Distributed tracing tools
- Unified dashboards
Key insight:
Without observability, distributed systems become black boxes.
7. Instrumentation: Designing for Observability
Observability is not something you add later—it must be designed.
Instrumentation involves:
- Adding logging at key points
- Capturing metrics for critical operations
- Enabling tracing across services
Examples:
- Log every API request with a unique ID
- Track response time per endpoint
- Trace database queries
Result:
The system becomes self-explanatory under stress.
8. Business-Level Observability
Technical metrics are not enough.
You must also track:
- Conversion rates
- Checkout success
- User drop-offs
- Feature usage
Why this matters:
A system may be “technically healthy” but failing business goals.
Example:
- Server uptime = 100%
- Checkout success rate = dropping
Only business-level observability reveals this gap.
Practical Implementation
To implement observability effectively:
Step 1: Define What Matters
- Identify critical user flows
- Map system dependencies
Step 2: Implement Metrics
- Track performance and business KPIs
- Use dashboards for visibility
Step 3: Structure Logs
- Use consistent format
- Add contextual information
Step 4: Enable Tracing
- Track requests across services
- Identify bottlenecks
Step 5: Set Smart Alerts
- Focus on trends, not just failures
- Reduce noise
Step 6: Continuously Improve
- Review incidents
- Refine observability strategy
Common Mistakes
1. Collecting too much data without structure
More data does not mean more insight.
Better approach: Focus on meaningful, actionable signals.
2. Ignoring correlation between data types
Metrics, logs, and traces used separately limit understanding.
Better approach: Integrate all three.
3. Setting poor alert thresholds
Too many alerts lead to fatigue.
Better approach: Prioritize critical and actionable alerts.
4. Adding observability too late
Retrofitting observability is difficult.
Better approach: Design systems with observability in mind.
Key Takeaways
- Observability enables proactive issue detection
- Metrics, logs, and traces form the core foundation
- Correlating data provides real insight
- Distributed systems require strong observability strategies
- Business metrics are as important as technical metrics
- Observability must be designed—not added later
Conclusion
In modern systems, failures rarely happen suddenly.
They build up silently—through latency, partial errors, and degraded dependencies.
Monitoring tells you when the system is broken.
Observability tells you when it is about to break.
The difference is critical.
Because by the time users report issues, the damage is already done.
A truly reliable system is not one that never fails—
It is one that detects, explains, and recovers from issues before users even notice.